Four Options Percentage Chart for Business Clarity
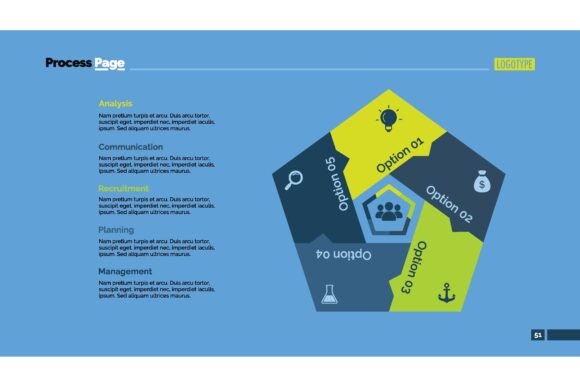
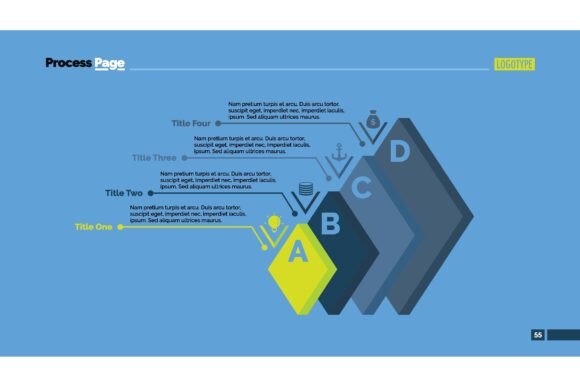
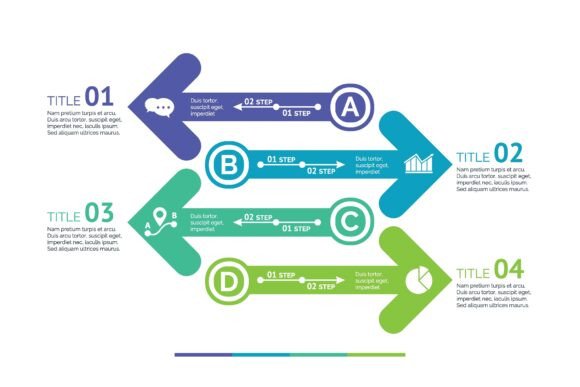
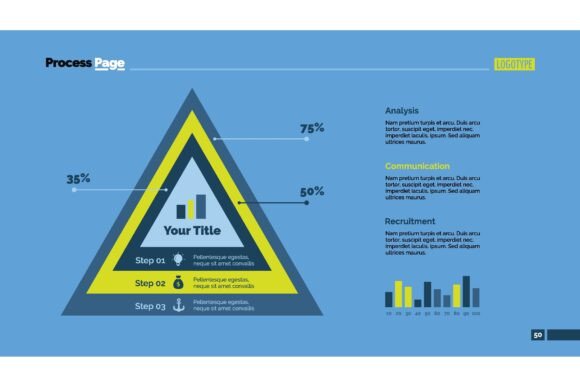
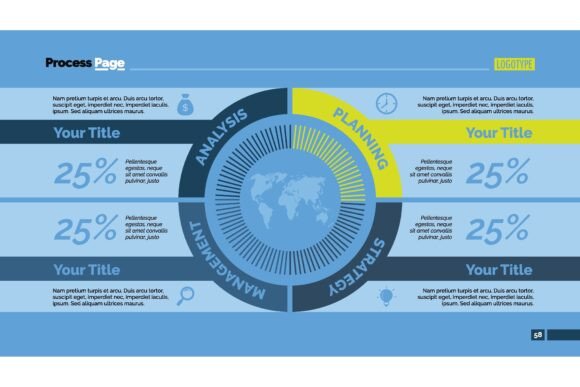
Numbers alone rarely tell the full story. The Four Options Percentage Chart transforms raw percentages into a clean visual structure that anyone can understand at a glance. Designed for business data, this format splits a whole into four distinct segments, each carrying its own percentage value. Whether you are mapping market share, survey responses, budget allocations, or customer preference splits, this chart type removes complexity without sacrificing accuracy.
What makes it especially useful is its restraint. Instead of overwhelming viewers with dozens of slices, it focuses attention on four deliberate categories. That constraint forces you to prioritise, which often leads to sharper insights before you even present the graphic.
What the Four Options Percentage Chart Actually Communicates
At its core, this chart answers one straightforward question: how does something divide across four meaningful groups? The visual weight of each segment immediately signals proportion. A segment occupying half the chart demands attention. Two thin slices sitting beside a dominant block tell a story of concentration or imbalance. Because the human eye processes relative size rapidly, viewers grasp the hierarchy without reading a single label.
The business applications stretch far beyond obvious pie-chart replacements. You can map quarterly revenue by product line, team capacity across four project types, or customer feedback grouped into four sentiment categories. The key is that the four segments must be mutually exclusive and collectively exhaustive enough to paint a complete picture of the scenario you are analysing.
Why Different Audiences Value This Chart Differently
The same visual tool serves remarkably different purposes depending on who holds it. Understanding these varied perspectives helps you decide whether this format fits your current challenge.
Small Business Owners and Entrepreneurs
For someone running a tight operation, time is the scarcest resource. The Four Options Percentage Chart offers a quick diagnostic view. Imagine a café owner reviewing where monthly revenue originates: dine-in sales at 45%, takeaway at 30%, catering at 15%, and merchandise at 10%. The chart does not require advanced analytics software or hours of training. It delivers a single-snapshot truth that informs decisions like staffing shifts or marketing spend, often built in a basic spreadsheet or a free online tool.
Practical example: A freelance photographer might divide annual income across wedding photography, corporate headshots, product shoots, and print sales. Seeing a heavy reliance on one category might prompt a diversification strategy before a seasonal dip hits.
Marketing Professionals and Strategists
Marketers care about storytelling and persuasion. A percentage chart with four options becomes a narrative device. When presenting campaign performance to stakeholders, the chart can segment traffic sources: organic search 40%, paid ads 25%, social media 20%, and email 15%. The visual instantly anchors the conversation on which channel deserves more investment. Marketers also value flexibility, often needing to adapt colours, labels, and supporting annotations to align with brand guidelines without rebuilding the entire graphic.
They also tend to evaluate a chart based on how well it integrates into slide decks, reports, and dashboards. A static chart that cannot be updated quickly loses relevance fast in fast-paced campaign environments.
Educators and Trainers
Instructors often reach for percentage charts to build data literacy. A teacher explaining survey methodology might create a Four Options Percentage Chart from classroom poll results: students who prefer visual learning, auditory learning, reading/writing, and kinesthetic approaches. The simplicity prevents cognitive overload while still teaching the relationship between parts and a whole. Educators prioritise clarity and accurate proportional representation over decorative elements. They also appreciate tools that allow learners to recreate the chart themselves without steep learning curves.
Practical example: A corporate trainer facilitating a workshop on time management might use the chart to show how participants currently spend their work hours across meetings, deep work, email, and administrative tasks. The visual sparks immediate reflection and discussion.
Content Creators and Bloggers
Visual content performs better across social platforms, newsletters, and blog posts. Creators use percentage charts to back up claims with evidence while keeping the feed scroll-stopping. A blogger writing about remote work trends might embed a chart showing how respondents split their work location preferences: fully remote 38%, hybrid 42%, occasional office 12%, and fully on-site 8%. The chart does double duty, it reinforces credibility and breaks up text.
Creators often value speed and export quality. They want to generate a polished chart, crop it to optimal dimensions, and publish without fiddling with design software for hours. Templates that accommodate quick data entry and offer transparent backgrounds or high-resolution downloads earn loyalty in this group.
What to Evaluate Before Building Your Chart
Different users bring different priorities, and recognising yours helps you identify whether the format aligns with your goals. Here are common evaluation criteria people consider, often unconsciously, when choosing a percentage chart style.
Ease of use matters most to beginners and time-pressed professionals. If the chart builder requires manual angle calculations or SVG coding, many will abandon it. Intuitive interfaces where you input four numbers and labels, then receive a finished graphic, win every time.
Visual quality and presentation matter to consultants, marketers, and anyone presenting to clients. Smooth curves, balanced spacing, readable typography, and harmonious colour palettes separate a professional deliverable from something that looks hastily assembled.
Data accuracy is non-negotiable for researchers, analysts, and financial professionals. A segment representing 33.3% should occupy exactly one-third of the total area. Slight distortions, rounding errors, or misleading 3D effects erode trust quickly among detail-oriented audiences.
Flexibility and customisation appeal to designers and advanced users. The ability to adjust segment colours individually, rotate the chart, add or remove percentage labels, and control legend placement provides creative freedom without sacrificing the underlying structure.
Speed and reliability support deadline-driven environments. Knowing a chart tool renders correctly every time, exports without artefacts, and does not crash mid-edit reduces friction for freelancers and small teams who cannot afford delays.
Learning value attracts educators and students who use the creation process as a teaching moment. Building a chart manually, perhaps by sketching and calculating angles, deepens understanding of proportional reasoning, even if digital tools remain the final output method.
Matching the Chart to Your Specific Project
Before committing to the Four Options Percentage Chart, ask yourself whether your data genuinely benefits from four categories. Some datasets naturally group into three or five meaningful buckets, and forcing a fourth category adds noise rather than clarity. Conversely, if you have six or more segments, consider whether merging smaller categories into an "other" group preserves the story without fragmenting the visual.
Also consider your audience's data literacy level. For highly technical stakeholders, you might supplement the chart with precise percentages and confidence intervals. For a general audience, clean labels and a short explanatory sentence alongside the graphic often suffice.
Think about where the chart will live. An embedded chart on a website needs responsive sizing and accessible colour contrast. A printed report demands high resolution and possibly grayscale compatibility. A live presentation benefits from sequential reveal, where segments appear one by one to guide attention deliberately.
Practical Scenarios Across Different Fields
Let's move from theory to tangible applications that show the chart's versatility across roles and industries.
- Budget planning: A nonprofit director allocates annual funding across programmes, administration, fundraising, and reserves. The chart makes the distribution transparent to board members and donors alike.
- Customer segmentation: An e-commerce manager categorises shoppers into loyal repeat buyers, occasional purchasers, one-time buyers, and window shoppers. Seeing the percentage of each group informs retention campaign urgency.
- Skill assessment: A career coach maps a client's self-rated proficiency across four core competencies. The visual highlights strengths and gaps that text alone might obscure.
- Product feature prioritisation: A product manager visualises user votes on which features matter most, helping the development team allocate sprint capacity with confidence.
- Health and wellness tracking: A personal trainer shows a client how their weekly activity splits across strength training, cardio, flexibility work, and rest, framing balance as a visual goal.
In each case, the chart's power lies not in complexity but in constraint. By limiting to four options, you prevent dilution and keep the conversation focused on what genuinely matters.
Avoiding Common Pitfalls
Even a straightforward chart benefits from thoughtful execution. One frequent misstep involves poorly chosen colour sequences. Adjacent segments with similar saturation or hue confuse viewers, especially those with colour vision deficiencies. Test your palette in grayscale to verify that each segment remains distinct.
Another pitfall is inconsistent rounding. If your four percentages sum to 99% or 101% due to rounding, acknowledge it in a footnote or adjust one segment slightly rather than leaving an unexplained gap that undermines credibility.
Finally, resist the temptation to decorate the chart with excessive drop shadows, gradients, or 3D tilts. These effects distort proportion perception and can make a 25% segment look larger or smaller than its true value. Flat, clean design preserves accuracy and reads as intentionally modern rather than plain.
Who Benefits Most from This Format
If you regularly present data to decision-makers, create educational materials, publish content that requires visual evidence, or simply want to understand your own numbers more clearly, the Four Options Percentage Chart earns its place in your toolkit. It rewards clarity over cleverness. It values the reader's time. It communicates without shouting.
Beginners appreciate the low barrier to entry. Experienced analysts appreciate the interpretative speed. Creators appreciate the aesthetic versatility. Across that spectrum, the common thread remains the same: a desire to make percentages meaningful rather than merely decorative. When your data fits the four-segment model, this chart type becomes one of the most honest and efficient ways to share what you have discovered.
The next time you face a spreadsheet column of percentages that feels flat or forgettable, consider whether four deliberate categories could unlock the insight hiding in plain sight. More often than not, the answer will be yes.